Profiler
An execution profiler is a tool that helps in analyzing the runtime performance of a program by measuring the number of times that individual parts of the program are executed and/or the time spent while executing each of these parts. This data can be used by developers to decide which parts of the program to optimize, and where restructuring the program could avoid doing unnecessary work. For example, in logic programming, if a predicate fails very frequently, this indicates computations that do not lead to a result and, depending on the program and the data, may be avoided by changing the clause order of a predicate, or changing the goal order in a clause.
Kahina's execution profiler for logic programs counts the number of times each step type (predicate) is called or redone, exits or fails. This is always done automatically as the debugger information from the logic programming system to which Kahina is connected (e.g. TRALE or SWI-Prolog) is recorded. The count information is also implicitly present in the control flow tree and can be computed from it post hoc. The profiler does not yet record the time that passes from entering a step to leaving it, although this is a planned feature.
Profiles
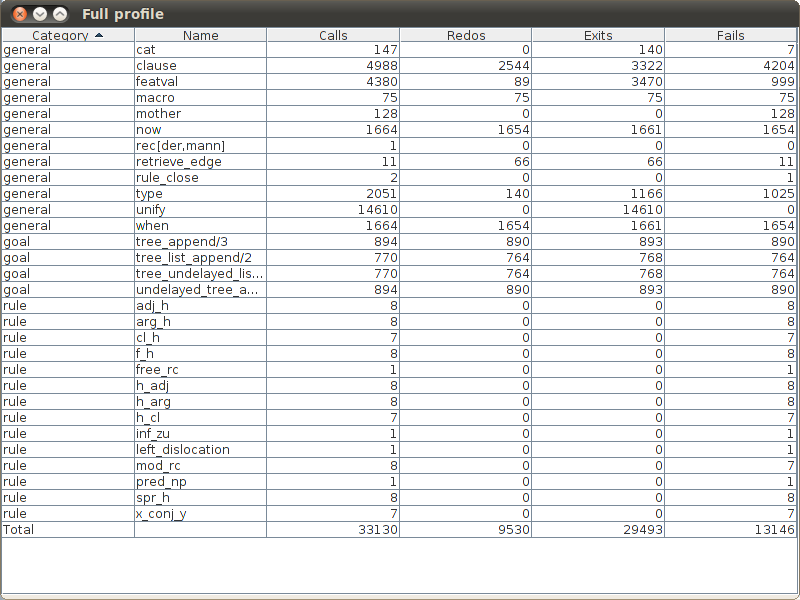
A profile of (part of) a program is represented as a table whose rows represent step types (predicates). The number of calls, fails, exits and redos of each step type is shown. For additional viewing comfort, the step types may be assigned categories in a manner specified by the concrete layer (e.g. the TRALE layer or the Prolog layer).
TRALE example
For TRALE, steps are currently classified into three categories: rule (rule applications), goal (goal calls) and general (everything else). Future version may have a more fine-grained set of categories, e.g. the one used in the documentation of ALE's source level debugger.
Here is an example profile, made during a parse of the phrase der Mann with a rather heavy-weight grammar:
Different profiles are available in Kahina:
- The full profile is the profile of the whole program run currently being recorded by Kahina. Show it by clicking Full profile in the Profiler menu.
- A subtree profile counts only the calls, fails, exits and redos of steps within a certain part of the ControlFlowTree?. This can be useful for assessing the performance of certain parts of a program. Remember that the control flow tree is actually a combined representation of two trees, the search tree and the call tree. So a subtree profile is defined by choosing a root node and then either traversing the search subtree or the call subtree rooted in that node.
- Show a search subtree profile by first selecting the root node of the desired subtree and then clicking Profile search subtree in the Profiler menu. A search subtree profile may be useful if you know that when control flow hit the root node, a "wrong" choice was made that will not lead to a solution. The profile then shows you the amount of unneccessary work done by the system after making the wrong decision and before failing and backtracking back past the wrong decision.
- Show a call subtree profile by first selecting the root node of the desired subtree and then clicking Profile call subtree in the Profiler menu. A call subtree profile may be useful for assessing the amount of work that executing a certain step requires, including all substeps.
Attachments (3)
- Prenzlgram-warn-edit.png (34.5 KB) - added by ke 8 years ago.
- Prenzlgram-warn-warn.png (7.2 KB) - added by ke 8 years ago.
- Prenzlgram-profile.png (51.0 KB) - added by ke 8 years ago.
Download all attachments as: .zip

