Kahina for SICStus Prolog tutorial
Kahina for SICStus Prolog is a graphical tracer for SICStus Prolog 3 (SP3). It is a tool for visualizing and better understanding the execution of Prolog programs. What sets Kahina apart from other graphical tracers is its open, extensible architecture and the possibility to store and visualize the whole execution across backtracking, not only the currently active branch, providing valuable insights into the functioning of programs that use backtracking extensively.
This tutorial will walk you through the essential functionality for graphically tracing a small Prolog program. Advanced functionality, such as breakpoints, execution profiling, or customizing the GUI, are not part of this tutorial. For them, please refer to the corresponding sections of the manual.
First Steps
After installing Kahina for SICStus Prolog, start an SP3 process (most commonly done by typing sicstus or sicstus3 on the command line).
First, make the ktrace module available by issuing the following query. If you want to use the graphical debugger frequently, you might want to add this line to your .sicstusrc resp. .sicstus.ini so the ktrace module is made available automatically on startup. In both cases, you need to adapt the path according to the location of your Kahina installation:
| ?- use_module('/home/ke/opt/kahina/kahinasicstus/ktrace').
Now is the time to consult the program that we wish to trace. For this tutorial, we use the example.pl program shipped with Kahina (again, adapt the path):
| ?- ['/home/ke/opt/kahina/kahinasicstus/examples/example.pl'].
This is what the example program looks like. It is not particularly useful in itself, it just serves for illustration:
a(X) :-
  b(X),
  c(X).

b(1).
b(2).
b(3).

c(1) :-
  false.
c(2) :-
  d.
c(3) :-
  d.

d.
Now enable tracing with Kahina like this:
| ?- ktrace.
To avoid weird interactions, this will first disable all breakpoints that may be enabled. Then, a special breakpoint is created which catches almost everything and executes special code to call Kahina. On asking a query, Kahina's GUI will now appear and allow you to trace the program graphically. So let's ask the following query:
| ?- a(X).
The GUI
You will immediately notice that the GUI has many different components, called views. The most central view is the control view:
The control view contains the buttons that are used to control the execution of the program being traced, step by step.
For the following, it suffices to keep clicking the creep button to go through all the steps one by one. But feel free to try the other buttons out for yourself!
The Control flow tree view is also very central, second only to the control view, since it always shows the whole program execution so far. More precisely, it shows a tree visualization of that execution. The execution of a program is broken down into many steps, visualized by little boxes that are nodes in the tree. Steps can be selected by clicking on the nodes in the tree view. The other two views depend on that selection, they always show information pertaining to the currently selected step. They are: the bindings view, which shows Prolog variable bindings, and the codeLocation view, which shows the Prolog source code and highlights the relevant line for each step....
Tracing
Let's creep through the execution of our a(X) query and see what each view shows at each step:
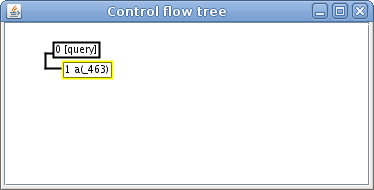
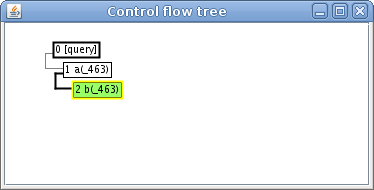
The control flow tree begins with a virtual root labeled 0 [query] that represents the query the user made. Its first child appears immediately, representing a call to the a/1 predicate. It bears the ID of the first step of the execution. In Prolog debugger terminology, a step is called an invocation box. The node is further labeled with the goal that is being called, in this case a(_430). If the goal was longer, it might be truncated in the tree view, so you might want to refer to the other views. The node is white, meaning that it has been called but not exited or failed yet, i.e. execution of step 1 is currently under way. Finally note the yellow border of the node, which indicates that it is the currently selected node. It is the data associated with the currently selected node that are displayed in the other views (that is, in dynamic views – snapshot views are different, but we won't turn to them until much later is this manual). Any node can be selected at any time by clicking on it. Also, whenever a node is newly created or changes its status (we will see a what a status change is in a second) during the execution of a program, it is automatically selected, as has just happened with this node.
No codeLocation is shown at this point yet because although we have a goal a(X), we haven't chosen a clause yet. It would arguably make sense to highlight the first clause of a/1. We're working on it.
Unfortunately, we cannot currently display query variables either, so we have an empty bindings view although it should say X _463. But it's easy enough at this point to see what's going on.
We click on the creep button and get to the next state:
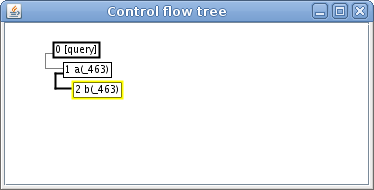
The b/1 predicate is called from within the only clause of the a/1 predicate, which creates step 2, which creates a new node in the control flow tree with that ID, which is automatically selected. Note that it is below the previous node because it was created after it, and indented to the right wrt. the previous node because it is the a/1 clause in which b/1 is called.
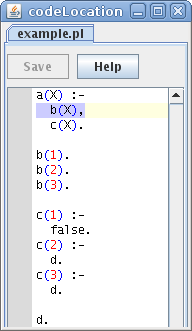
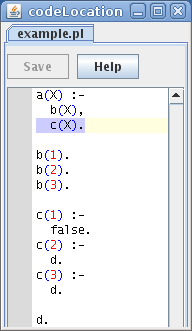
We are now in the first and only a/1 clause and are calling the first subgoal, b(X). This goal is highlighted in the codeLocation view.
There is one variable name in this goal, X. Within the a/1 clause, X refers to a variable which is not bound at this point, so the bindings view displays a variable identifier like _463. Note that this value is in the Before column, as in “before executing the present goal, this is the state of the variable referred to by X”. If the goal binds the variable and succeeds, we will later see the value in the After column.
Let's creep on:
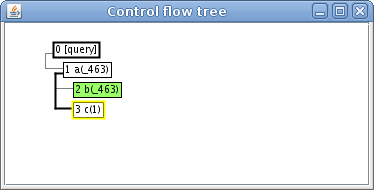
The first b/1 clause succeeds immediately with the solution X=1 (which we see in the bindings view), thus the corresponding step reaches an exit port and we see the first status change: the status of the corresponding node changes from called to exited nondeterministically – nondeterministically because b/1 has further clauses and thus there may be further solutions. Statuses are by default represented by node colors. In this case, the node changes from white to light green.
The a/1 clause has one more subgoal that remains to be called, so the b/1 node gets a sibling in the call tree, visualized by the fact that both are indented at the same level and connected with lines to the parent a/1 node in the same way. Note how the configuration of the three nodes mirrors the formatting of the a/1 clause in the source code, making the relations between goals and subgoals clear. The new node is of course white and selected because it has just been called. The variable X, and thus the argument of the b/1 goal, is already bound to 1, as can be seen in the node label and in the bindings view. So there is only one c/1 clause that can be chosen here.
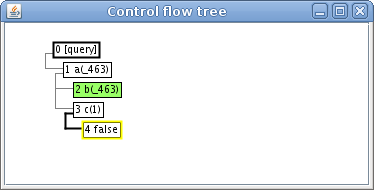
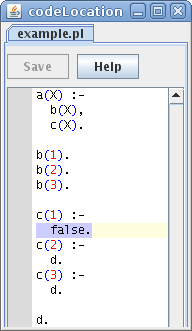
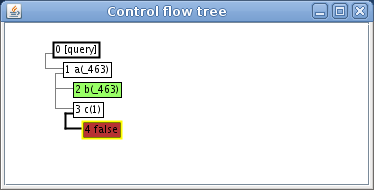
And it has false as a subgoal! This goal does not contain any variables, so the bindings view is empty.
false fails immediately, of course. The corresponding node changes its status to failed and turns red.
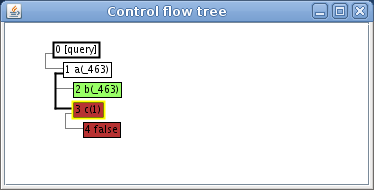
So does the parent. Here we see control flow go back up in the call tree, causing a node recreated earlier to be selected again. Although execution of the goal c(X) (with X=1) has completed, the After column in the bindings view is empty since the goal has failed and therefore does not contribute any variable bindings.
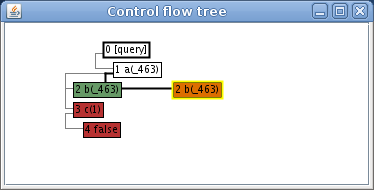
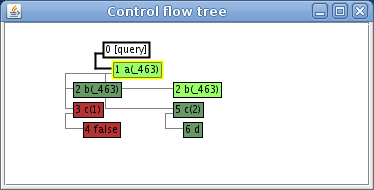
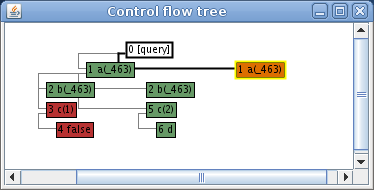
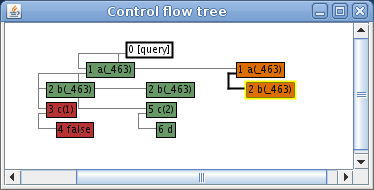
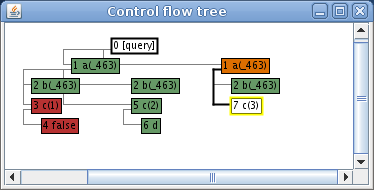
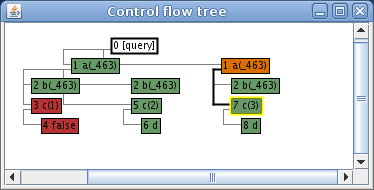
So this attempt to satisfy the goal a(X) has failed, but step 2 is still an open choicepoint, visualized by the light green node, to which Prolog now automatically backtracks. At this moment, the visualization of the execution, which until now has been a straight line of steps (albeit indented to reflect the structure of the call tree), forks! Step 2 reaches the redo port, i.e. it is executed anew, so to speak. This is visualized by a new node with step ID 2 which is created. Its status is redone, the color is orange. It is placed next to the first node of step 2, as a sibling in the search tree. We see that the tree view visualizes not one, but two trees: the call tree we already know, it is visualized by indentation and lines, the "Windows Explorer" style tree visualization. The search tree is visualized by a larger structure, where sibling nodes are placed next to each other and below their parents (the parent is the 1 node in this case). This is the most common style for visualizing trees e.g. in computer science and linguistics, except that by default Kahina does not draw the edges of the search tree. The search tree primarily serves to visualize backtracking – where it branches, backtracking has taken place. It is one of the key features setting Kahina apart from simpler GUI tracers that only show the current callstack. Finally, note that the first node of step 2 has become dark green, which stands for the status exited deterministically. While this is not yet really true for step 2 (b/1 has one more clause), the design decision that only the most recent node of a step should indicate nondeterminacy was taken to facilitate getting a quick overview of active choicepoints.
In the bindings view, the Before column does not differ from what we saw when we first called this goal, because when we redo a goal, all the bindings its previous execution contributed are undone and we start from square one. However, the After column still has the value from the previous execution of step 2 which we already saw when we hit its exit port. This value may change during re-execution and is merely displayed as a reminder at the redo port.
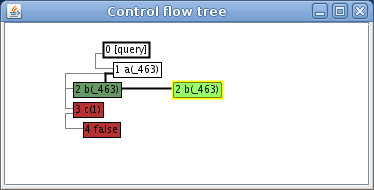
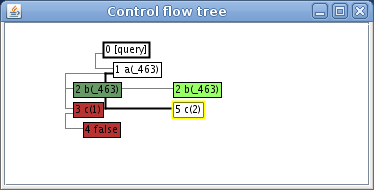
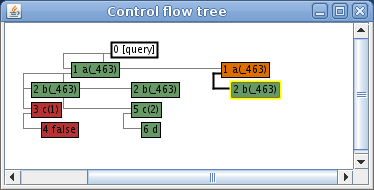
The second clause of b/1 succeeds immediately, step 2 thus reaches the exit port and the new node turns light green – step 2 is still an active choicepoint, and its newest node as taken over the burden of marking that.
And we see that we have a new binding for X: 2.
Again, c/1 is called with the argument already bound by b/1, this time to 2. Note how this creates a new step (5) rather than a new node for the old step 3 since that step came after the choicepoint and is part of a branch that has failed. We are now in the second clause of c/1, which does not fail, ...
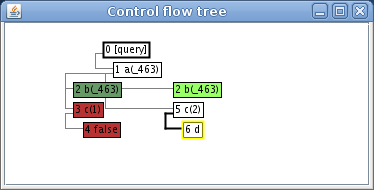
...but just calls d/0...
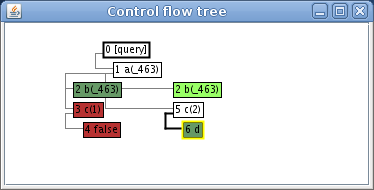
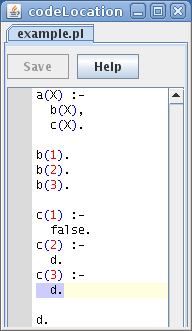
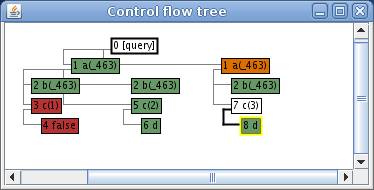
...which succeeds, ...
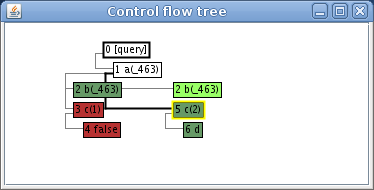
...so does the parent step (note that in this case, there is a variable binding, but it hasn't changed during execution of the goal)...
...and, for the first time, step 1. Since its substep 2 is still an active choicepoint, 1 is also marked as exited nonderterministically since redoing step 2 would also mean to redo step 1. At this point, the solution found for the query, X=2, is presented at the Prolog prompt, and you can either accept that solution by hitting Return, or let Prolog search for another one, by entering a semicolon (;). Let's do the latter...
...causing Prolog to go through the redo ports of all ancestors of the most recent active choicepoint (in this case, there is just one ancestor), causing Kahina to create new orange nodes along the way...
...until the choicepoint is reached. We are now in the last clause of b/1, which binds X to 3.
With that, step 2 has run out of choice points and the corresponding node is marked as exited deterministically right away.
This is a binding that c/1 accepts in the same way as it did X=2, so the rest is basically a repetition of what we already saw...
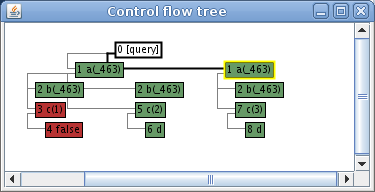
...only that since there are now no active choicepoints among its call tree descendants, step 1, too, exits deterministically. All two solutions have been found, no further choicepoints are open. Control returns to the Prolog prompt again, for a new query.
Aborting a trace
You can abort the tracing process at any time by just closing Kahina's GUI.
Disabling graphical tracing
To continue using Prolog without graphical tracing, issue:
| ?- noktrace.
Attachments (45)
- Screenshot-bindings-1.png (4.0 KB) - added by ke 8 years ago.
- Screenshot-bindings-2.png (4.6 KB) - added by ke 8 years ago.
- Screenshot-bindings-2b.png (4.6 KB) - added by ke 8 years ago.
- Screenshot-bindings-2c.png (4.6 KB) - added by ke 8 years ago.
- Screenshot-bindings-2d.png (4.7 KB) - added by ke 8 years ago.
- Screenshot-bindings-2e.png (4.7 KB) - added by ke 8 years ago.
- Screenshot-bindings-2f.png (4.6 KB) - added by ke 8 years ago.
- Screenshot-bindings-3.png (4.3 KB) - added by ke 8 years ago.
- Screenshot-bindings-4.png (4.0 KB) - added by ke 8 years ago.
- Screenshot-bindings-5.png (4.4 KB) - added by ke 8 years ago.
- Screenshot-bindings-5b.png (4.4 KB) - added by ke 8 years ago.
- Screenshot-bindings-6.png (4.0 KB) - added by ke 8 years ago.
- Screenshot-bindings-7.png (4.4 KB) - added by ke 8 years ago.
- Screenshot-bindings-7b.png (4.4 KB) - added by ke 8 years ago.
- Screenshot-bindings-8.png (4.0 KB) - added by ke 8 years ago.
- Screenshot-codeLocation-2.png (7.0 KB) - added by ke 8 years ago.
- Screenshot-codeLocation-3.png (7.0 KB) - added by ke 8 years ago.
- Screenshot-codeLocation-4.png (7.0 KB) - added by ke 8 years ago.
- Screenshot-codeLocation-5.png (7.0 KB) - added by ke 8 years ago.
- Screenshot-codeLocation-6.png (7.0 KB) - added by ke 8 years ago.
- Screenshot-codeLocation-7.png (7.0 KB) - added by ke 8 years ago.
- Screenshot-codeLocation-8.png (7.0 KB) - added by ke 8 years ago.
- Screenshot-Control flow tree-1.png (5.5 KB) - added by ke 8 years ago.
- Screenshot-codeLocation-1.png (4.1 KB) - added by ke 8 years ago.
- Screenshot-Control flow tree-1b.png (7.9 KB) - added by ke 8 years ago.
- Screenshot-Control flow tree-1c.png (8.3 KB) - added by ke 8 years ago.
- Screenshot-Control flow tree-1d.png (8.3 KB) - added by ke 8 years ago.
- Screenshot-Control flow tree-2.png (5.9 KB) - added by ke 8 years ago.
- Screenshot-Control flow tree-2b.png (6.2 KB) - added by ke 8 years ago.
- Screenshot-Control flow tree-2c.png (7.6 KB) - added by ke 8 years ago.
- Screenshot-Control flow tree-2d.png (7.6 KB) - added by ke 8 years ago.
- Screenshot-Control flow tree-2e.png (8.6 KB) - added by ke 8 years ago.
- Screenshot-Control flow tree-2f.png (8.4 KB) - added by ke 8 years ago.
- Screenshot-Control flow tree-3.png (6.6 KB) - added by ke 8 years ago.
- Screenshot-Control flow tree-3b.png (7.0 KB) - added by ke 8 years ago.
- Screenshot-Control flow tree-4.png (7.0 KB) - added by ke 8 years ago.
- Screenshot-Control flow tree-4b.png (7.0 KB) - added by ke 8 years ago.
- Screenshot-Control flow tree-5.png (8.1 KB) - added by ke 8 years ago.
- Screenshot-Control flow tree-5b.png (8.3 KB) - added by ke 8 years ago.
- Screenshot-Control flow tree-6.png (8.3 KB) - added by ke 8 years ago.
- Screenshot-Control flow tree-6b.png (8.3 KB) - added by ke 8 years ago.
- Screenshot-Control flow tree-7.png (8.8 KB) - added by ke 8 years ago.
- Screenshot-Control flow tree-8.png (9.0 KB) - added by ke 8 years ago.
- Screenshot-Control flow tree-8b.png (9.0 KB) - added by ke 8 years ago.
- Screenshot-Control flow tree-7b.png (8.7 KB) - added by ke 8 years ago.
Download all attachments as: .zip


